Observability
llm.port helps you understand what is happening in your AI system day to day.
You can quickly answer questions like:
- Are requests healthy and fast?
- Which models are being used most?
- Where is cost going up?
- Who changed what, and when?
What you can observe
- Request activity and outcome trends
- Latency and throughput indicators
- Cost estimates per request, model, provider, and user
- Pricing catalog management with version history
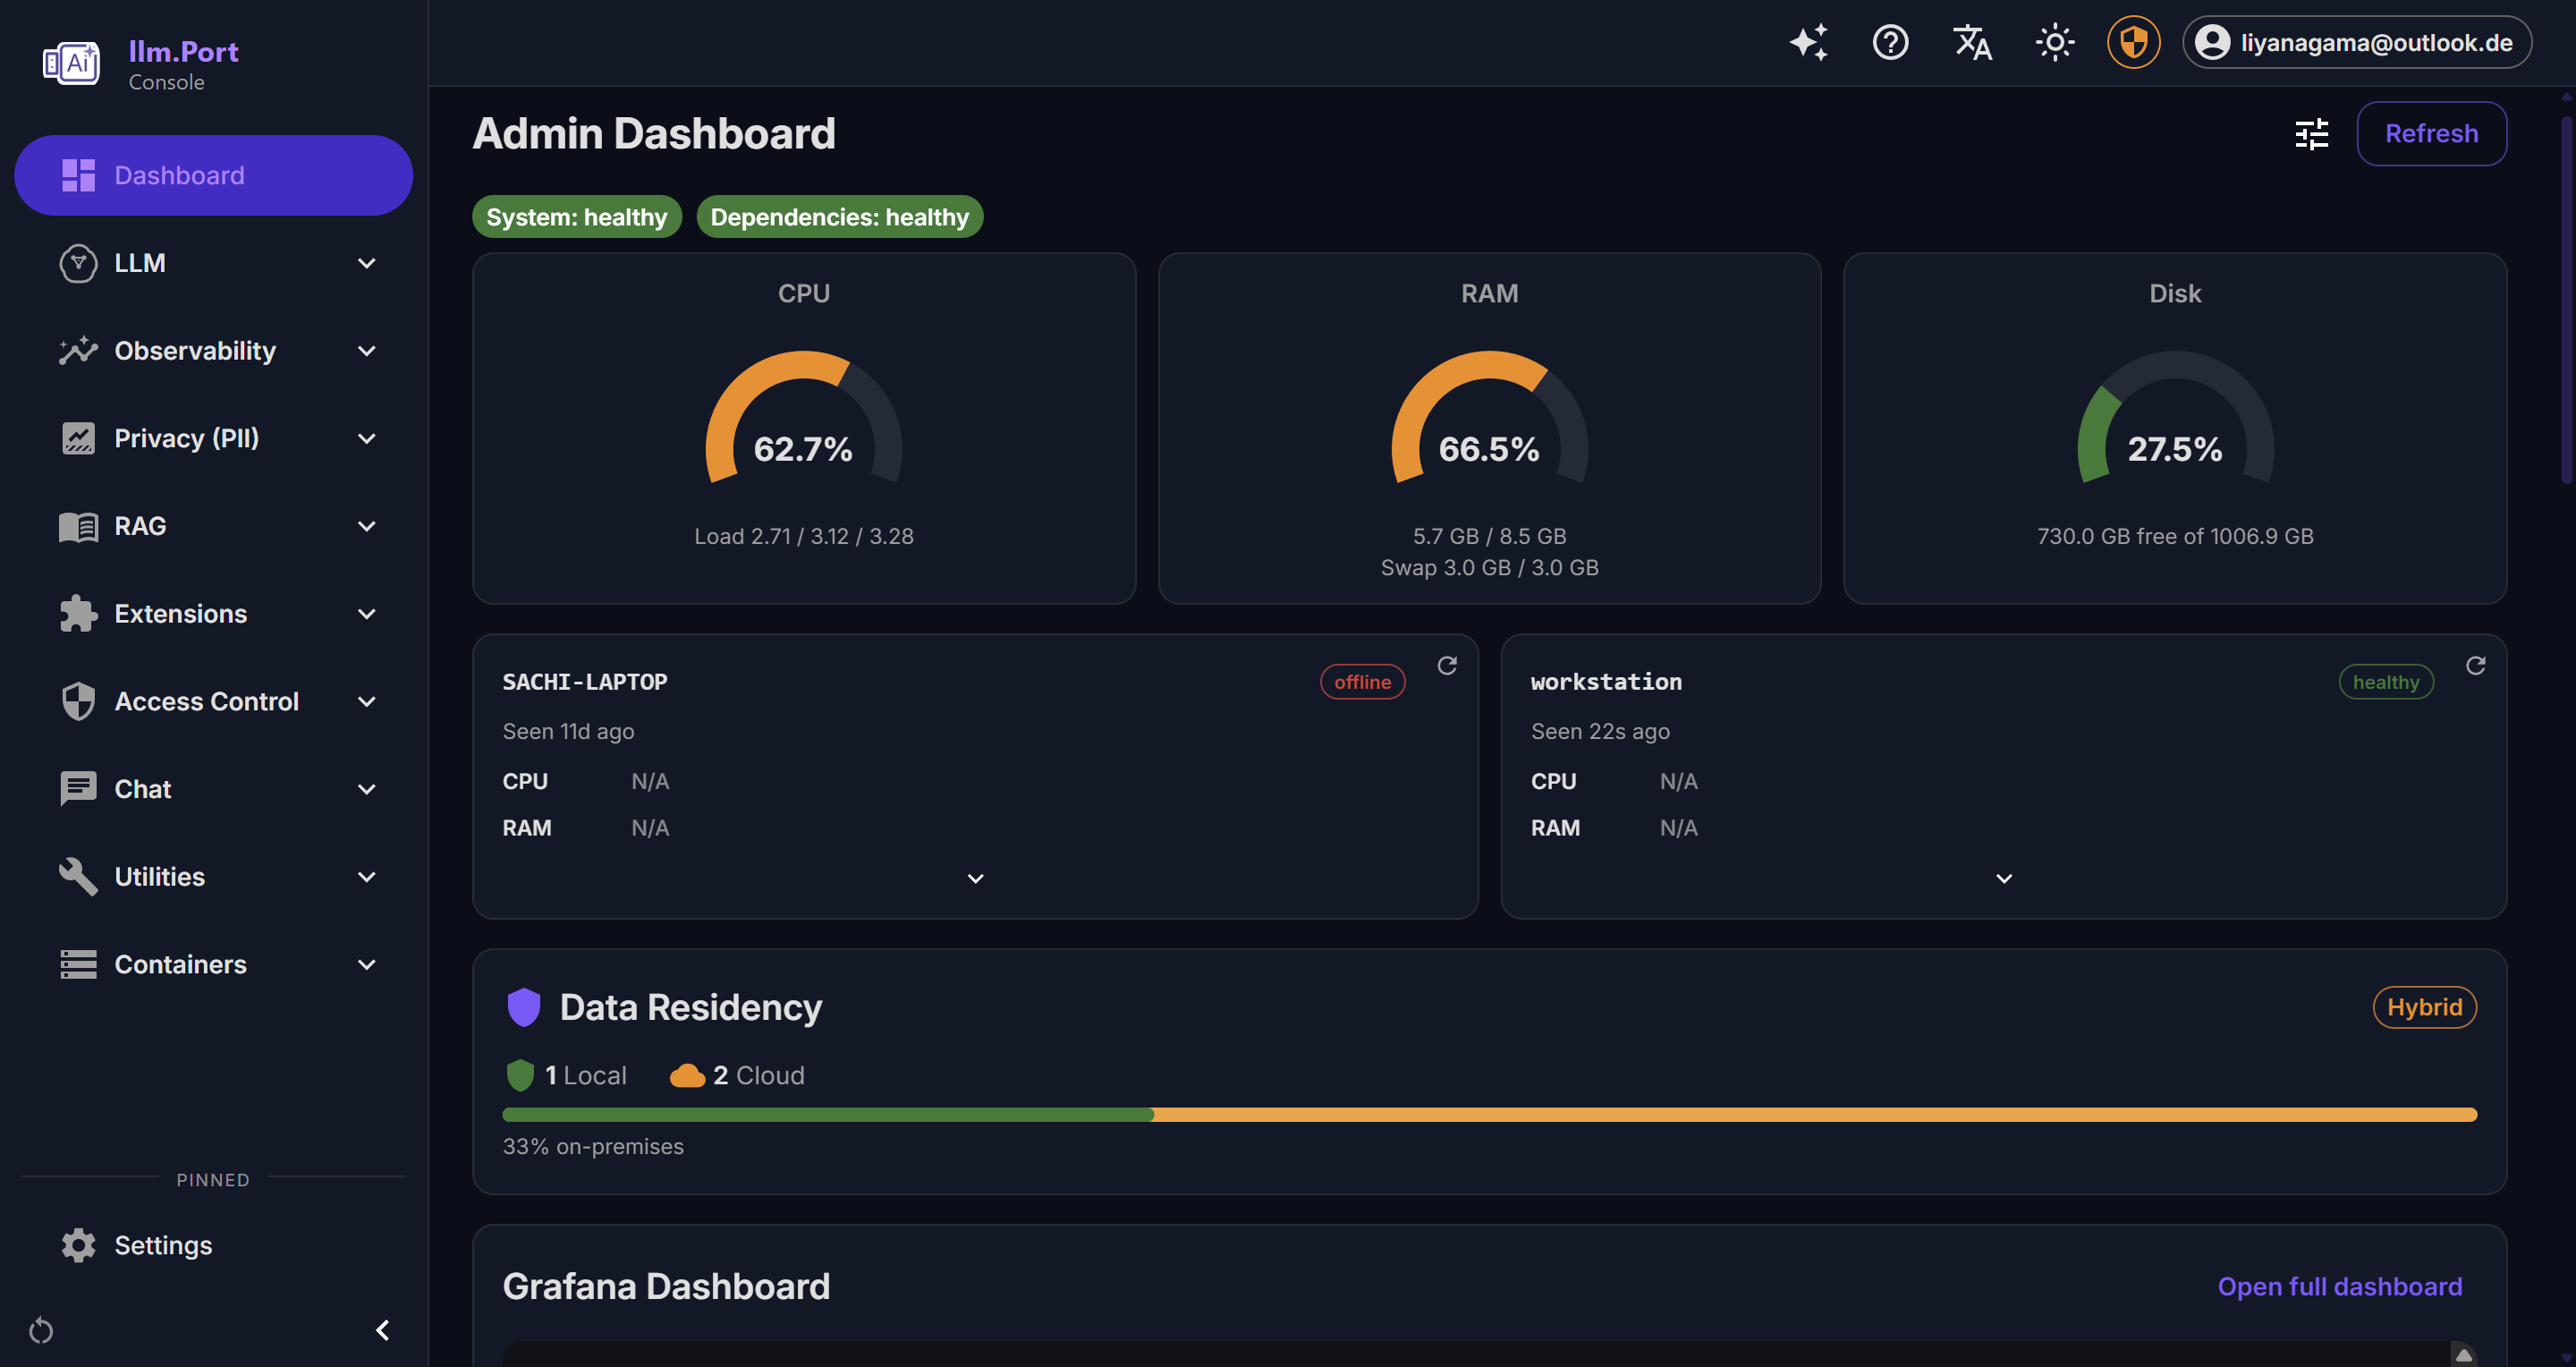
- System health and service behavior
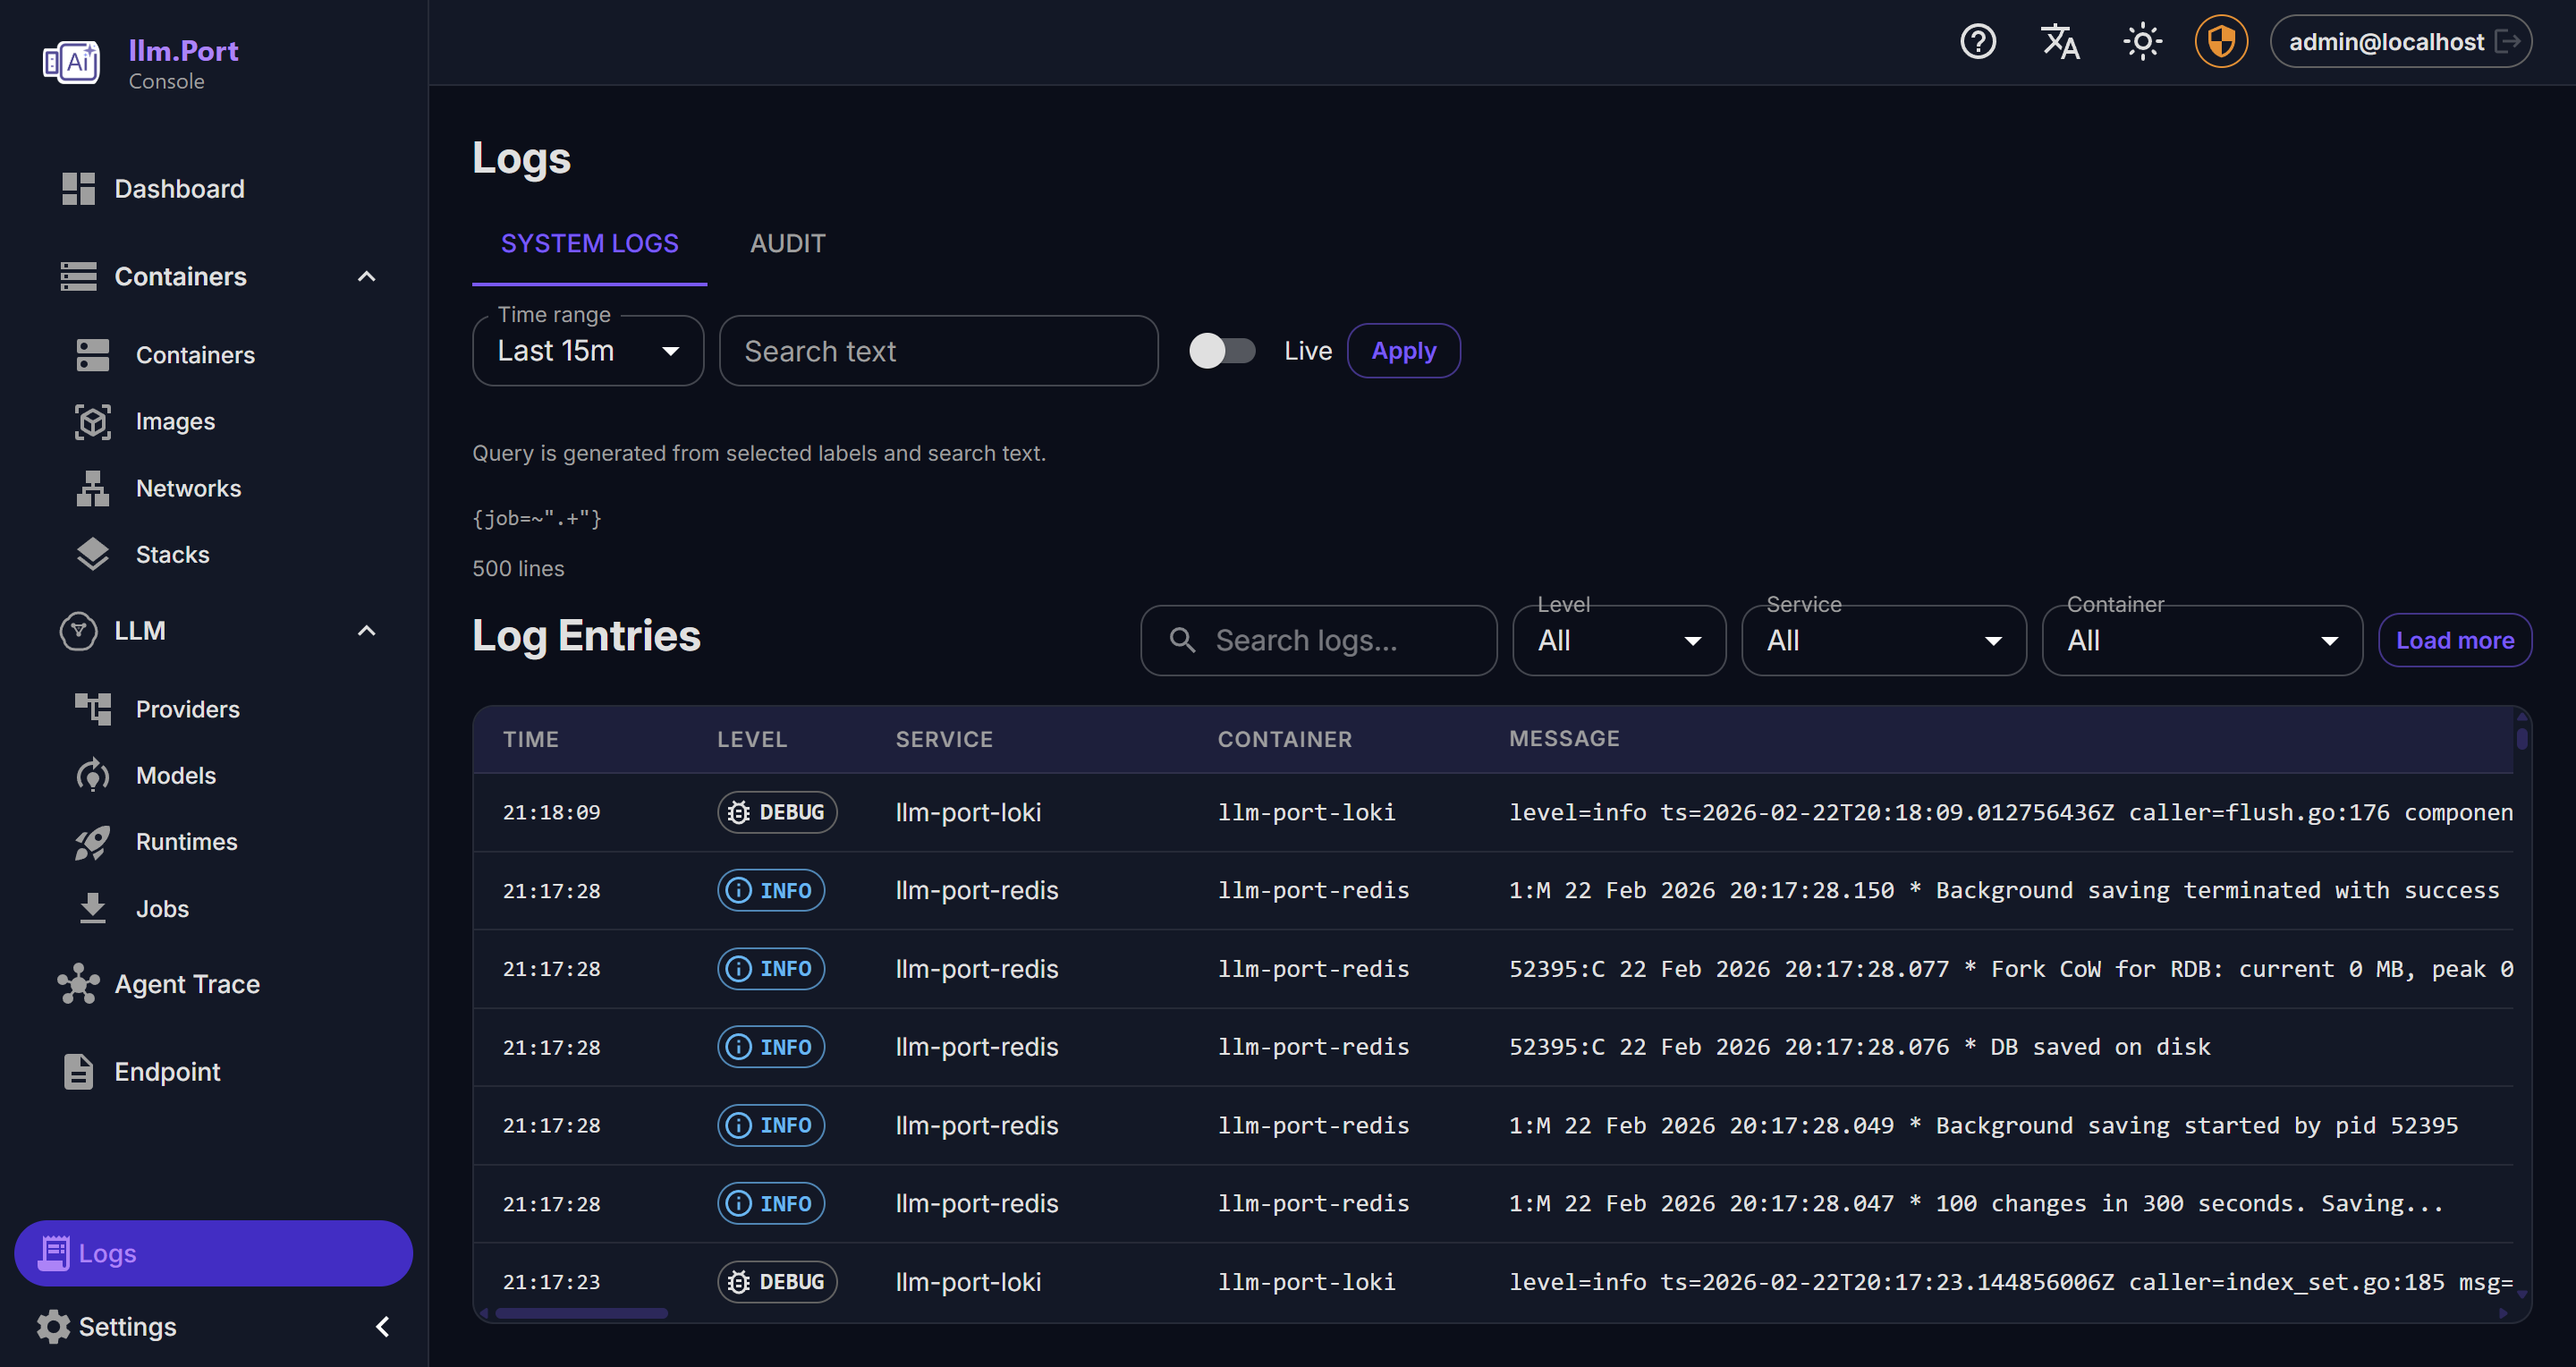
- Administrative action trails
Cost Observability Dashboard
The Cost Observability dashboard (Admin → Observability → Cost Dashboard) provides self-contained cost tracking without external dependencies.
Overview Tab
| Widget | Description |
|---|---|
| Estimated Spend | Total estimated cost for the selected period |
| Total Requests | Number of gateway requests |
| Total Tokens | Prompt + completion tokens consumed |
| Avg Latency | Average request latency |
| Error Rate | Percentage of requests with 4xx/5xx status |
| Cost Over Time | Line chart of cost per day/hour |
| Request Throughput | Line chart of requests per day/hour |
| Latency Percentiles | Bar chart of p50/p95/p99 latency |
| Spend by Model | Bar chart of cost per model |
| Top Users | Table of users ranked by request count |
Use the date range selector (7d / 14d / 30d / 90d) to focus on the time window you care about. Use CSV Export when you want to share or analyze data outside the UI.
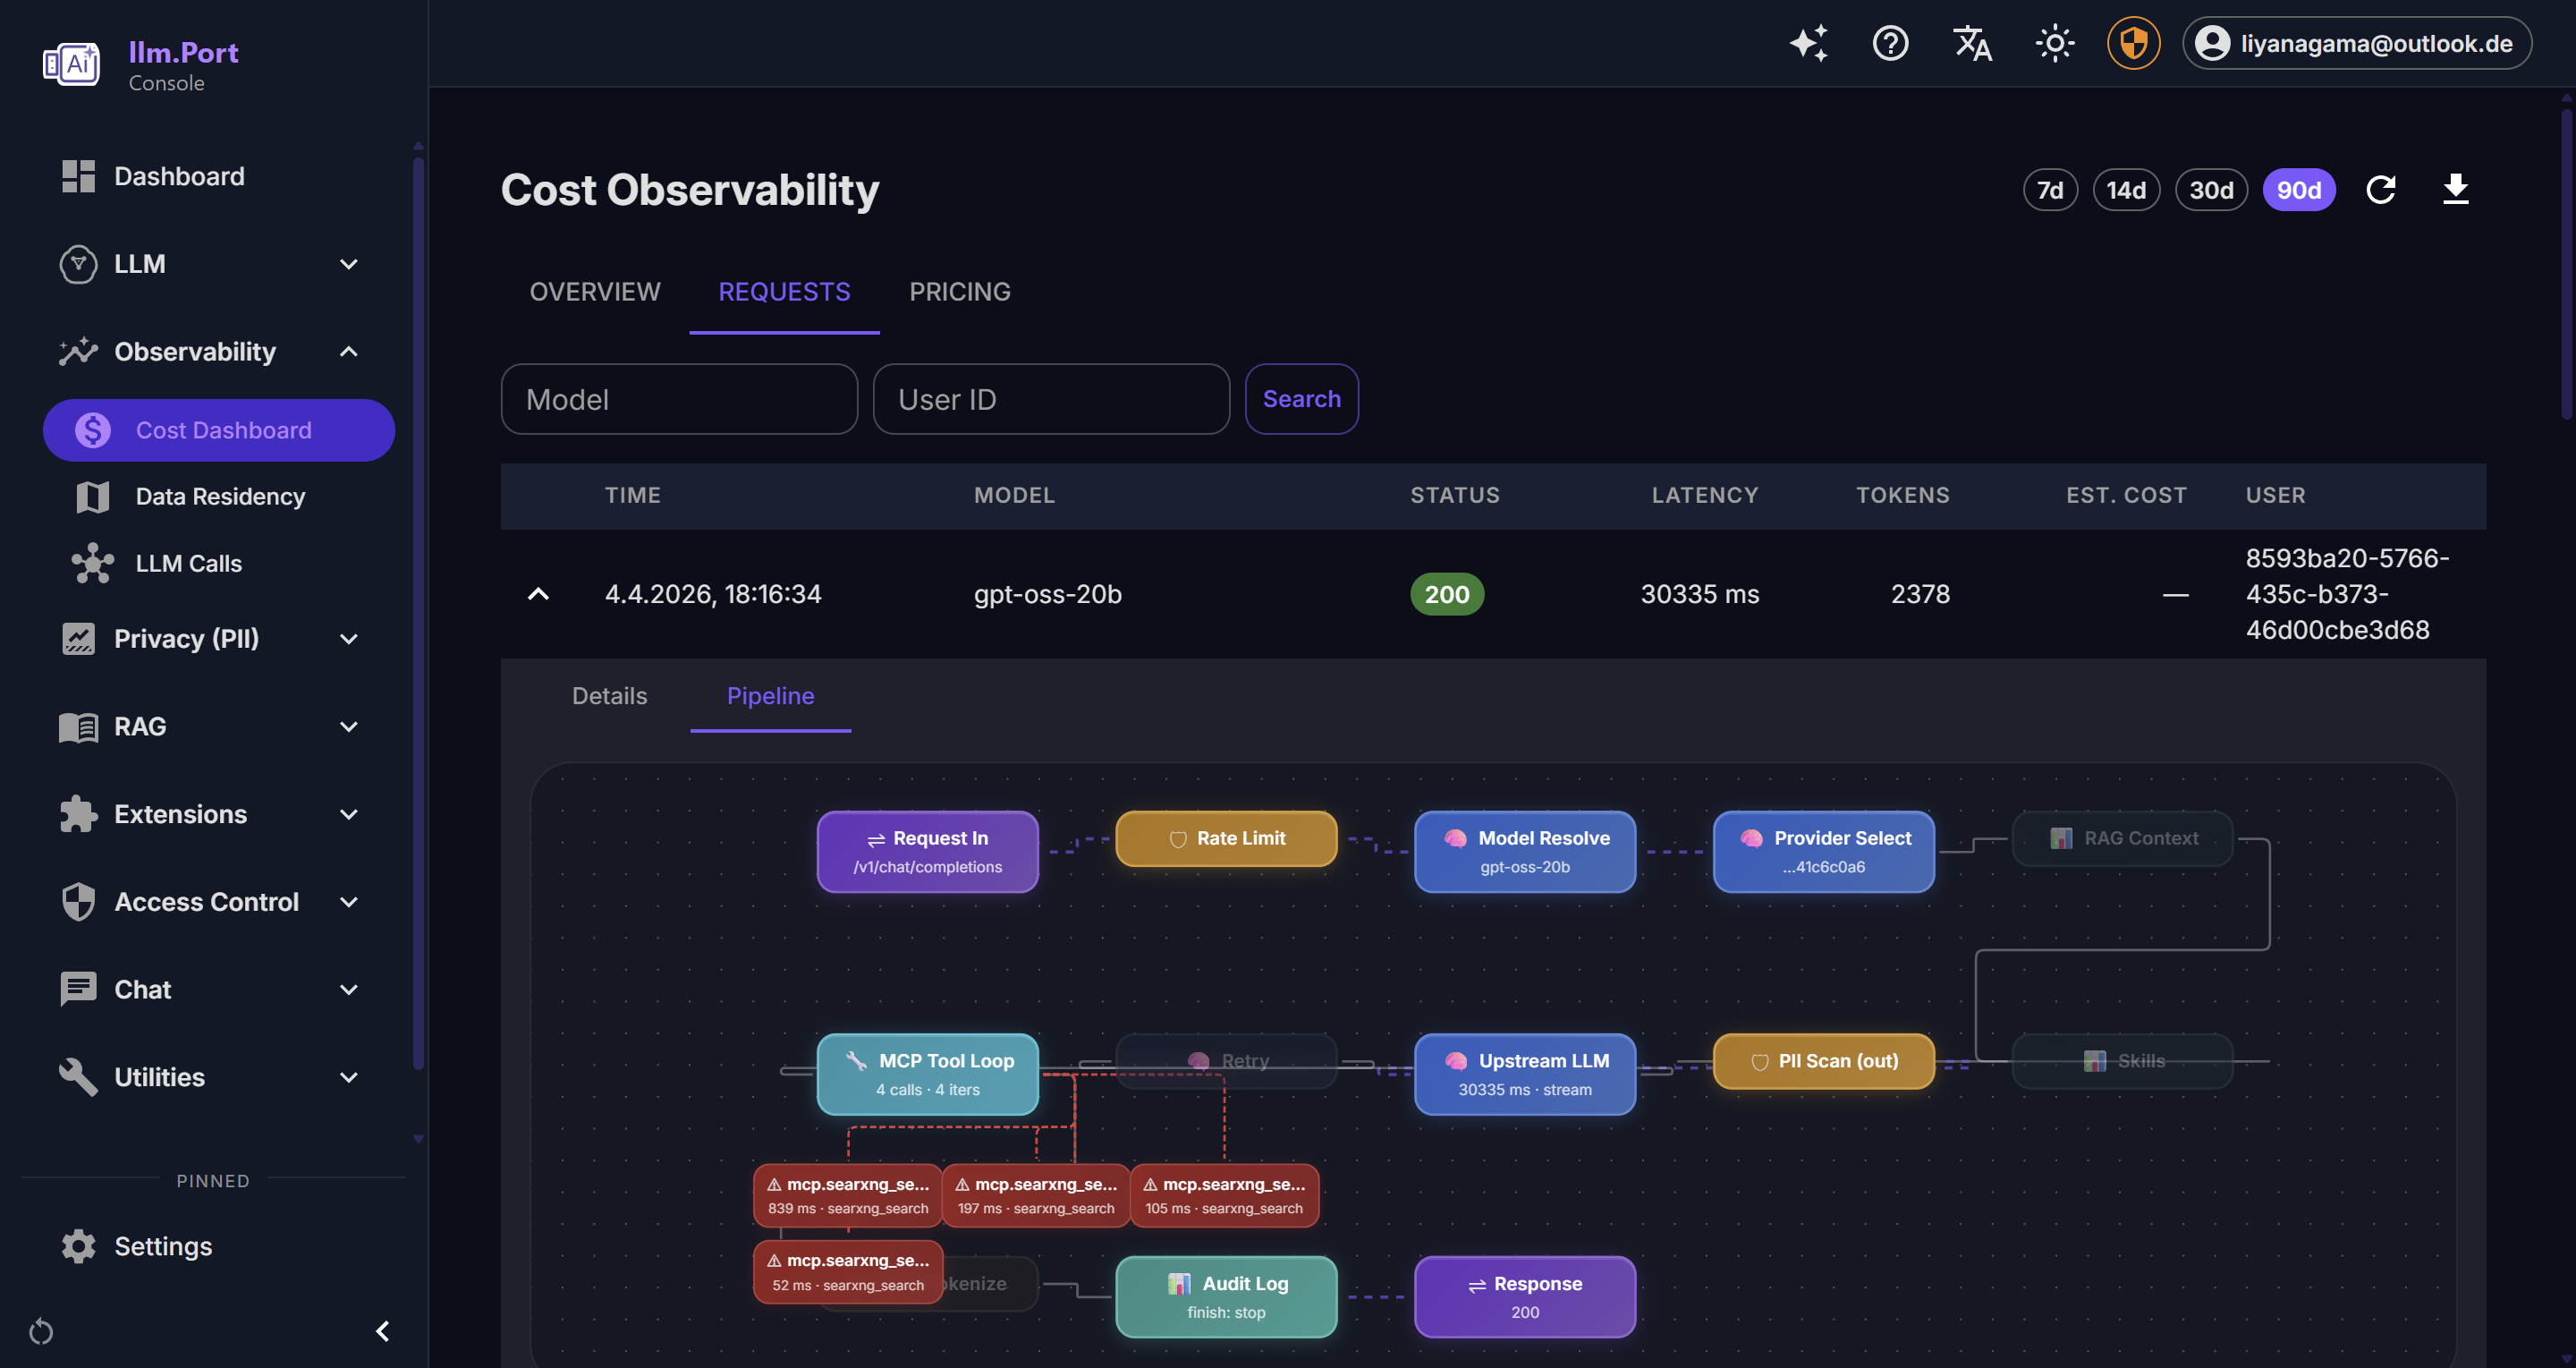
Requests Tab
Paginated log of all gateway requests with:
- Filters: model alias, user ID
- Expandable detail: request ID, trace ID, provider, tokens, TTFT, cost breakdown, estimate status
- Status badges: color-coded HTTP status
This is usually the fastest place to investigate a user-reported issue.
Pricing Tab
Manage the cost catalog used for request-level estimates:
- Add new provider/model pricing entries
- Edit prices (creates a new version, deactivates the old one)
- Delete (deactivate) entries
- View history per model to audit price changes
- Seed data included for common models (GPT-4.1, Claude Sonnet 4, Gemini 2.5 Pro, etc.)
Note: Prices are estimates for visibility and planning. They do not change provider billing.
How cost estimates work
- Each gateway request is matched against the price catalog by provider + model
- Cost is calculated:
(prompt_tokens / 1000) × input_price + (completion_tokens / 1000) × output_price - Cached tokens are deducted from prompt token count before pricing
- Each request gets a
cost_estimate_status:complete,partial(missing tokens or price), orunavailable
Enterprise Edition extensions
The following features require the Enterprise Edition license:
- Budget management — set monthly spend limits per tenant
- Cost forecasting — projected spend based on historical trends
- Alerting — threshold-based alerts for cost, error rate, latency
- Chargeback reports — per-tenant cost allocation
Why this matters
- Faster incident detection and troubleshooting
- Better governance and compliance reporting
- Data for capacity planning and optimization
- Cost visibility without external observability platforms
For most teams, this becomes the single source of truth for AI operations.
Recommended operating practice
- Define alert thresholds for key service indicators
- Review usage and access trends regularly
- Keep retention policies aligned with compliance requirements
- Review and update model pricing when providers change rates
Public docs focus on observable outcomes and operating guidance, not internal telemetry plumbing.
Screenshots